How to separate operational reporting from management analytics and build a governed data layer around Business Central
Business Central contains a large amount of operational and financial information, but having the data does not automatically create useful management reporting.
Many organisations start by asking for more reports inside the ERP. Over time, that can produce a collection of exports, spreadsheets and dashboards that all calculate the same measure slightly differently.
A stronger approach separates transactional reporting from analytics. Business Central remains the system of record. Power BI and, where justified, Microsoft Fabric provide the analytical layer. The difficult work is agreeing the data, measures and ownership between them.
Three key takeaways
- 1.Business Central should remain authoritative for its transactions, while Power BI can provide reusable analytical models, visualisation and cross-company reporting.
- 2.Data quality and measure definitions matter more than dashboard design. A polished report built on inconsistent dimensions or master data is still unreliable.
- 3.Use supported APIs and analytical endpoints deliberately. Reporting architecture should be designed around business measures, security and ownership rather than direct access to every table.
Business Central reporting starts with the transaction model
Business Central can produce financial statements, operational lists, account schedules and role-based pages without a separate analytics platform. Those capabilities are useful because they sit directly on the current transactional data.
The limitation is that operational reporting and management analytics are not the same problem. A finance user may need to explain this month's margin by customer, product and dimension. An executive team may want the same information alongside CRM pipeline, service performance and workforce data.
That is where the reporting architecture needs to move beyond 'which report should we build in Business Central?' and ask where each type of analysis should live.
Power BI is the natural analytical layer for many Business Central estates
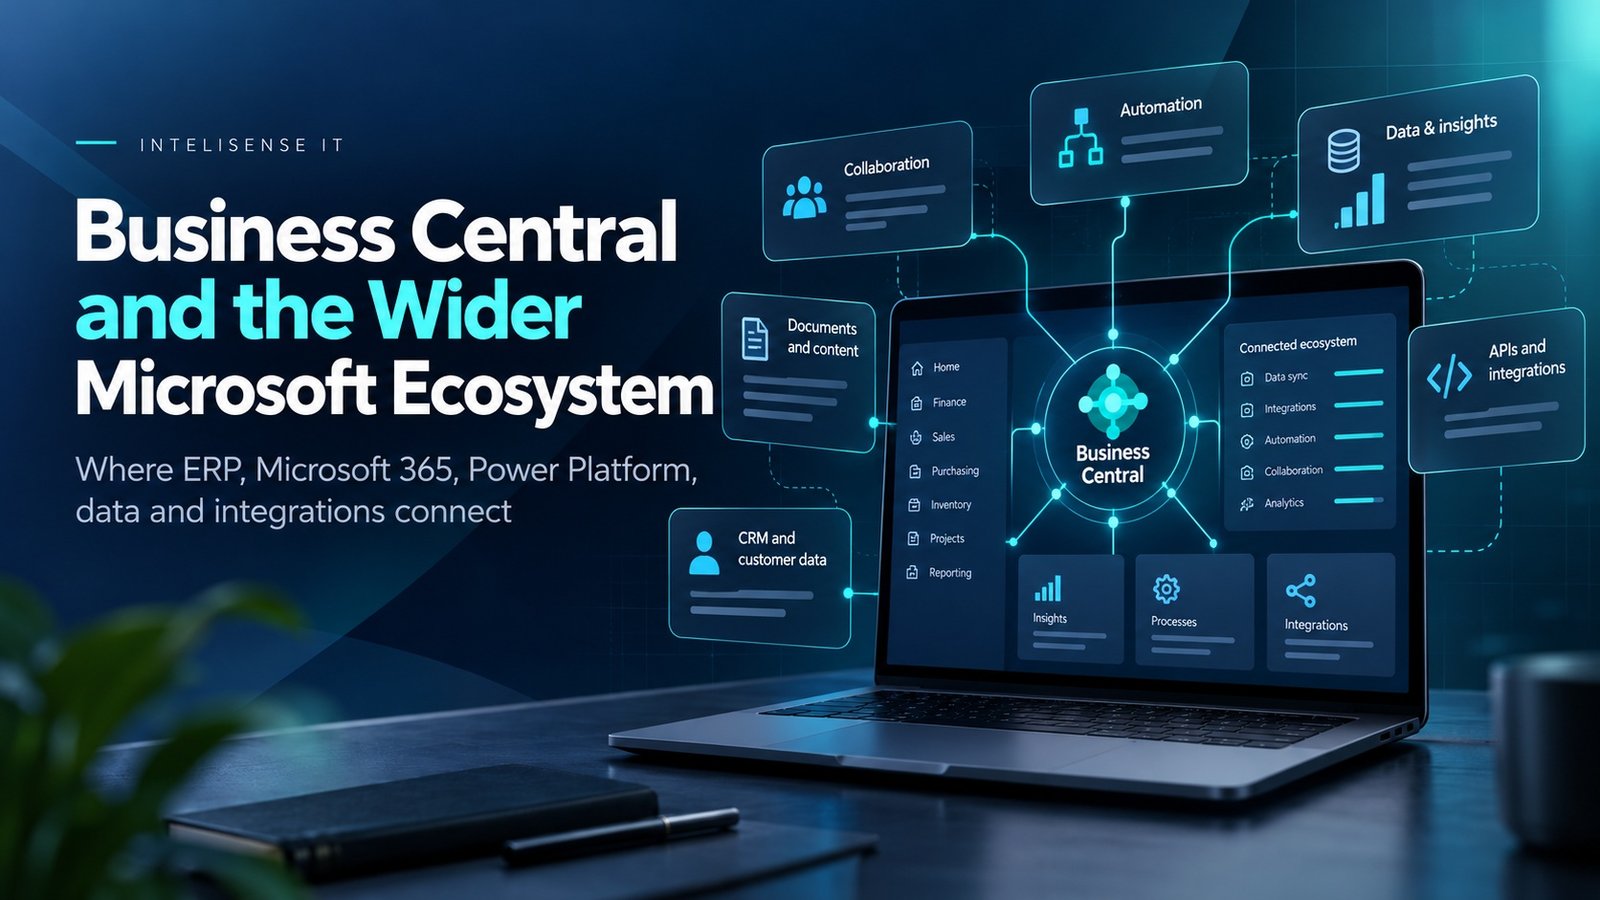
Microsoft supports connecting Power BI semantic models to Business Central and embedding Power BI reports, pages and visuals back into the Business Central client.
Business Central online includes standard APIs and can expose custom API pages and queries. Microsoft recommends API pages and queries for reliable integration scenarios, while OData web services remain available for appropriate reporting use cases.
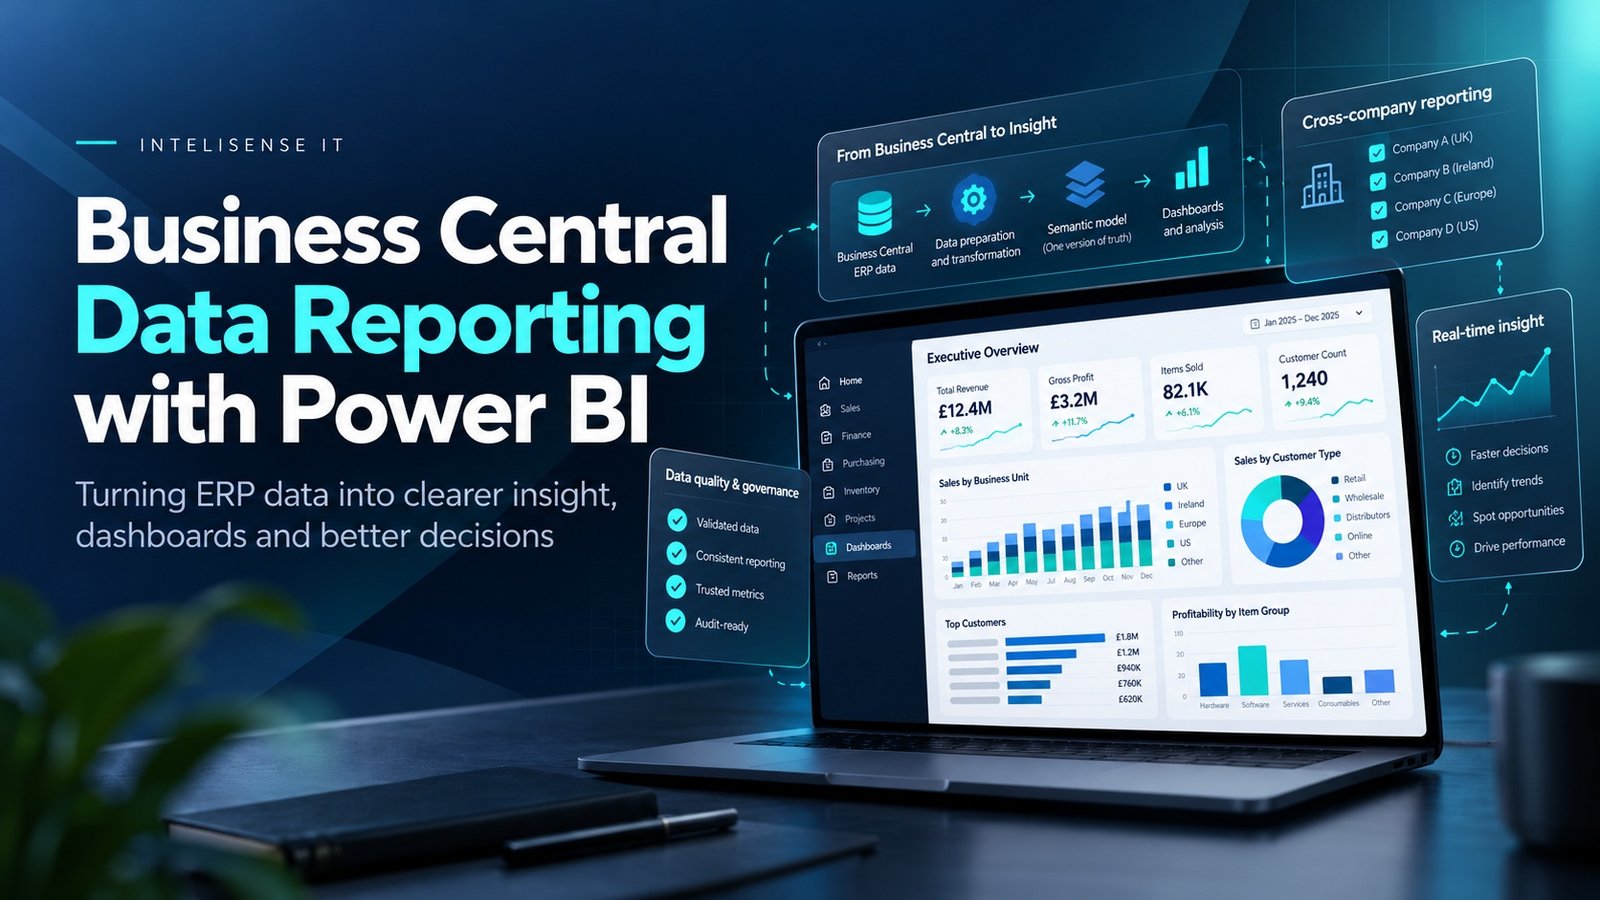
This gives organisations a useful separation. Business Central remains the system of record for transactions, while Power BI provides modelling, visualisation, cross-company analysis and wider management reporting.
The Analytics API changes how standard Power BI content can be built
Microsoft's Analytics API provides read-only Business Central endpoints designed specifically for analytical and reporting scenarios. The standard Business Central Power BI apps use these APIs to retrieve data.
That matters because analytical workloads should not be designed like transactional integrations. Reporting usually needs stable, read-only datasets, predictable refresh and measures that can be reused across multiple reports.
Using a reporting-oriented API also makes the architecture easier to explain: transactional APIs serve business processes, while analytical APIs serve reporting and analysis.
Standard Power BI apps are useful starting points, not the final reporting strategy
Microsoft publishes Business Central Power BI apps across several functional areas, including finance, inventory, inventory valuation, manufacturing, projects, purchasing, sales, subscription billing and sustainability. These can provide useful dashboards quickly and help teams understand the shape of the available data.
An organisation should still test whether the standard model answers its management questions. Reporting structures often depend on dimensions, chart of accounts, product hierarchies, project structures and bespoke operational measures.
The standard app can therefore be a baseline. A governed semantic model is often the better long-term answer when several departments need consistent measures and definitions.
Cross-company reporting needs deliberate modelling
Business Central organisations often operate several companies or environments. Microsoft's standard Business Central Power BI template apps work per company, but Microsoft also documents how custom Power BI queries can load data from multiple companies or environments by parameterising Business Central API calls and combining the resulting datasets.
The technical pattern is straightforward compared with the governance questions. Are account structures consistent? Do dimensions mean the same thing in every company? Are currencies converted consistently? Which company owns shared customers or products?
Cross-company reporting works best when those definitions are agreed before a consolidated dashboard is built.
Data quality determines whether the dashboard can be trusted
A polished visual does not repair inconsistent ERP data. If salespeople use dimensions differently, buyers change supplier references casually or item categories mean different things across companies, Power BI will reproduce that inconsistency at scale.
The reporting programme should therefore identify the fields that drive important measures and confirm who owns them. Dimensions, posting groups, dates, quantities, units of measure, customer groups, item categories and project structures are common examples.
Where possible, validation should occur in the process that creates the data rather than in a reporting clean-up layer added later.
When Microsoft Fabric becomes relevant
Power BI can be sufficient for many Business Central reporting requirements. Microsoft Fabric becomes more relevant when the organisation needs a broader governed data platform covering multiple operational sources, data engineering workloads, reusable enterprise datasets or wider analytics scenarios.
In that model, Business Central is one governed source within a larger analytical estate. Data from CRM, service, ecommerce, manufacturing technology or external platforms can be combined with ERP transactions without asking Business Central to become the enterprise data warehouse.
The key decision is not whether Fabric is newer. It is whether the organisation needs capabilities that justify another data layer and can operate the governance around it.
Do not build reporting directly on every table you can reach
Access to data is not the same as a reporting design. Pulling dozens of Business Central tables into Power BI can create fragile models that are hard to explain and expensive to maintain.
A better approach starts with business measures. Revenue, gross margin, aged debt, stock turns, purchase performance and project profitability each need defined grain, filters and ownership.
Once the measure is understood, the team can select the API, query or analytical dataset that supports it. That reduces the tendency to expose internal application structures simply because they are available.
Security and reporting need to stay aligned
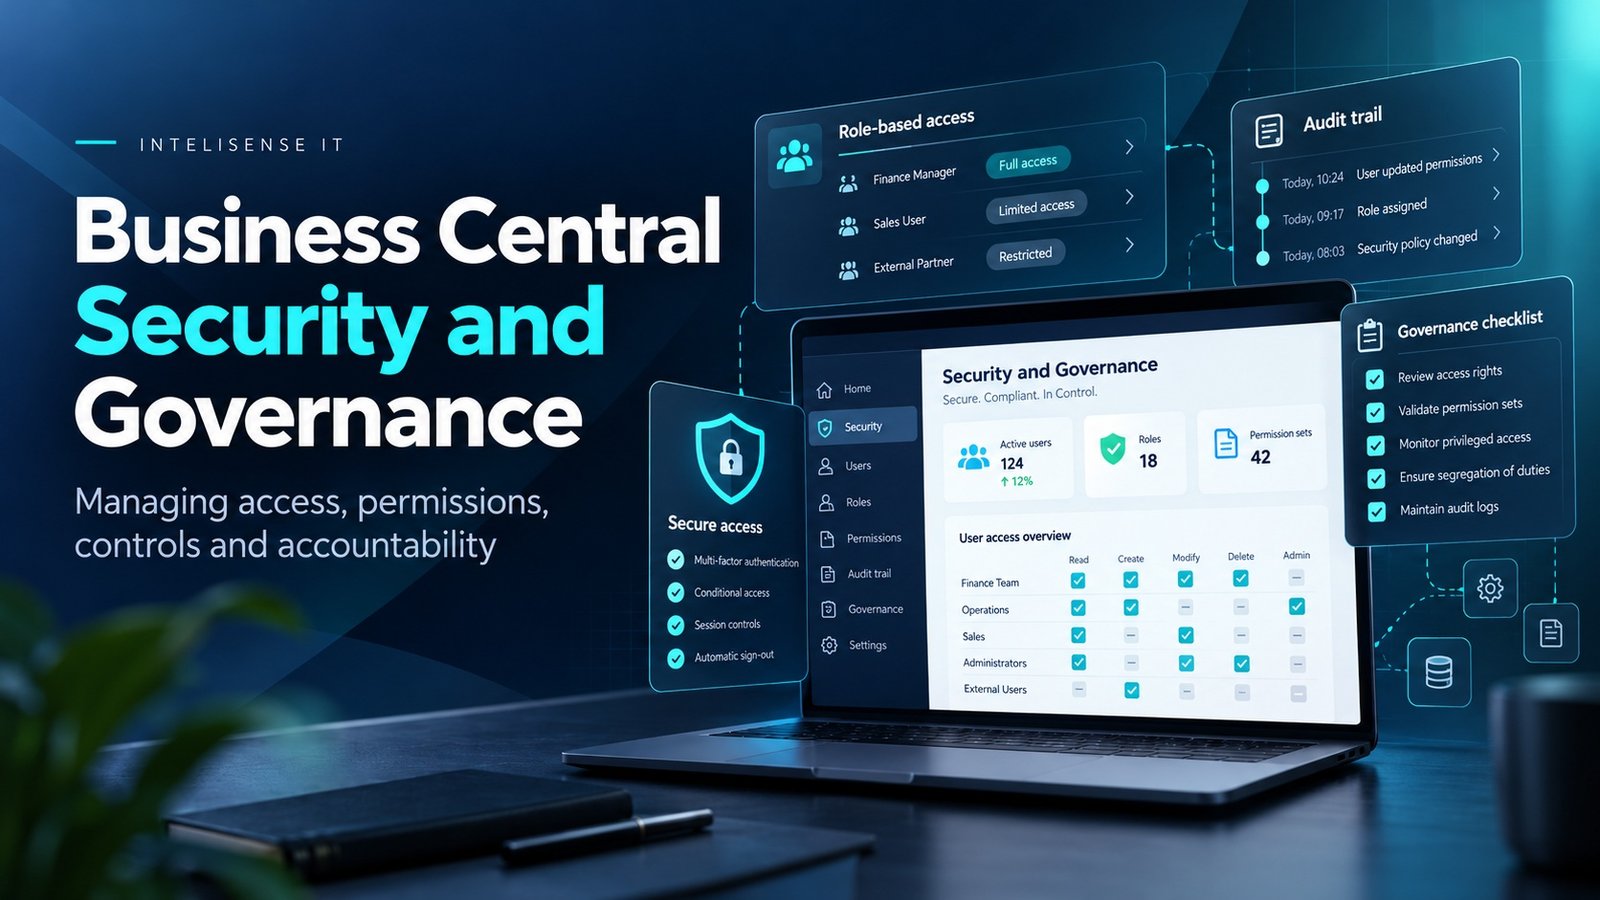
Power BI access should not accidentally bypass the intent of the ERP permission model. A user who cannot see sensitive data in Business Central should not automatically receive it through a broad reporting dataset.
Business Central APIs use Microsoft identity and permission controls, while Power BI has its own workspace, semantic-model and row-level-security options. The architecture needs to consider both layers.
Data export and refresh credentials should also have named owners. A reporting solution becomes operationally fragile when nobody knows which service identity refreshes it or what permissions that identity holds.
A practical reporting architecture for Business Central
- 1.Define the management questions first. Agree the measures, owners and frequency before selecting tools.
- 2.Separate operational reporting from analytical reporting. Keep real-time transactional questions close to Business Central and use Power BI for broader analysis.
- 3.Choose supported data interfaces. Prefer stable APIs, queries and analytical endpoints over uncontrolled table extraction.
- 4.Create reusable measures. Gross margin, sales, inventory and project metrics should mean the same thing across dashboards.
- 5.Design cross-company rules. Align dimensions, currencies, hierarchies and consolidation logic.
- 6.Secure the data path. Review source permissions, service identities, Power BI access and sensitive data.
- 7.Monitor refresh and quality. A dashboard should show when data is stale and have an owner for failed refreshes or broken measures.
How to know when reporting has become too complicated
Complexity is not measured by the number of dashboards. The warning sign is when different reports answer the same question differently and nobody can explain which definition is authoritative.
Another warning sign is when every new question requires a developer to reverse-engineer Business Central tables again. That usually means the organisation needs a reusable semantic model or analytical layer rather than another one-off report.
The end goal is not more reporting. It is a small number of trusted definitions that can be reused across finance, operations and management.
Work with a Dynamics 365 Business Central partner in the UK
InteliSense IT helps organisations design Business Central reporting around trusted business measures rather than a growing collection of disconnected dashboards.
Our consultants can review Business Central data quality, Power BI architecture, API and Analytics API usage, cross-company reporting, refresh design, security and the role of Microsoft Fabric where a wider analytical platform is justified.
We can also rationalise inherited reporting estates where spreadsheets, Power BI models and ERP reports disagree on the same management figures.
Frequently asked questions
Can Power BI connect directly to Business Central?
Yes. Microsoft supports connecting Power BI to Business Central using the Business Central connector and supported API or OData sources. Business Central can also display embedded Power BI content.
What is the Business Central Analytics API?
It is a read-only API designed for analytical and reporting scenarios. Microsoft uses it for standard Business Central Power BI apps.
Does Business Central include standard Power BI apps?
Yes. Microsoft provides Business Central Power BI apps across functional areas including finance, inventory, inventory valuation, manufacturing, projects, purchasing, sales, subscription billing and sustainability. The standard apps work per company and can be extended or supplemented with custom Power BI models where required.
Can Power BI report across multiple Business Central companies?
Yes. Microsoft documents patterns for parameterising Business Central API calls and combining data from several companies or environments.
Do we need Microsoft Fabric to report on Business Central?
Not necessarily. Power BI can meet many requirements. Fabric becomes relevant when the organisation needs a broader governed data platform across multiple systems or more advanced data-engineering and analytical workloads.
Should Power BI use the same security as Business Central?
The two layers need to be aligned. Business Central API access follows Microsoft identity and application permissions, while Power BI has its own access and row-level-security controls. The overall design should prevent reporting from exposing data more broadly than intended.
Build a reporting model people can trust
A useful reporting programme should reduce argument about the numbers. The organisation should know where a measure comes from, who owns it, when it was refreshed and which system is authoritative.
InteliSense IT can assess the current Business Central reporting estate and design a practical roadmap covering Power BI, data quality, semantic models, cross-company analysis and wider Microsoft data architecture.
Speak to InteliSense IT about a Business Central reporting and analytics assessment.
Sources
Microsoft Learn - Integrate Business Central with Power Platform https://learn.microsoft.com/en-us/dynamics365/business-central/dev-itpro/powerplatform/powerplatform-integration-overview
Microsoft Learn - Build Power BI reports for Business Central data https://learn.microsoft.com/en-us/dynamics365/business-central/across-how-use-financials-data-source-powerbi
Microsoft Learn - Enable Power BI integration https://learn.microsoft.com/en-gb/dynamics365/business-central/admin-powerbi-setup
Microsoft Learn - Analytics API overview https://learn.microsoft.com/en-us/dynamics365/business-central/dev-itpro/api-analytics/api-analytics-overview
Microsoft Learn - Use Business Central apps in Power BI https://learn.microsoft.com/en-us/dynamics365/business-central/across-powerbi-business-central-apps
Advisory note: This article was accuracy-checked on 15 October 2026. Power BI licensing, Business Central APIs, template apps and Microsoft Fabric capabilities can change, so confirm the current Microsoft documentation before implementation.